> ## Documentation Index
> Fetch the complete documentation index at: https://docs.powerdrill.ai/llms.txt
> Use this file to discover all available pages before exploring further.
# AI Report Generator
> Generate high-quality data report in one click
export const community_0 = undefined
## Introduction
Powerdrill's AI Report Generator is a newly released feature designed to accelerate data insight discovery. By harnessing AI, it streamlines the creation of detailed, comprehensive reports, significantly reducing the time and effort required. Whether you're in healthcare, finance, marketing, or other industries, this feature enhances efficiency by quickly uncovering key insights hidden within your data. Transforming the way you process information, Powerdrill's AI Data Report Generator enables faster, more accurate data-driven decision-making.
With the AI Report Generator, turning raw data into a comprehensive report is just one click away. This powerful feature allows users to streamline data analysis and reporting, unlocking the full potential of your data with minimal effort. Key benefits include:
* **Automatic insights**: Effortlessly uncover valuable insights from your raw data, giving you a clearer understanding of the underlying information.
* **One-click generation**: The process is as simple as it gets—just click a button and let Powerdrill take over. In no time, your raw data will be transformed into a polished, organized report.
* **Automated data visualization**: Instantly convert data insights into visually appealing charts and graphs.
* **PowerPoint conversion**: Need to present your data? No problem. With one click, your report is converted into ready-to-use PowerPoint slides, helping you create impactful presentations without any hassle.
* **Customized content**: Don't like something in your report? Simply edit the question to fit your needs, and Powerdrill will instantly generate fresh content based on your new query.
* **Easy sharing**: Sharing your insights with others is effortless. You can share the link to your reports with your teammates, friends, or anyone you want, or download your reports and visualizations as PNG or PDF files.
## How to use AI Report Generator
### Method 1. Generate a report by uploading new files
1. In the AI data agent section, find **AI Data Report Generator**, and click **Get started**.
Alternatively, click **Try our demo** if you don't have a suitable data file at hand.
 2. Select the files you want to analyze.
Up to 10 files can be uploaded at a time. If you want to analyze more files, check [method 2](#method-2-generate-a-report-from-an-existing-dataset)
3. Wait for the report to generate.
Once ready, you can download the report as a Word, Markdown, or PDF file, or open it directly in Notion or Google Docs for editing and sharing.
4. Edit the questions you don't like and let Powerdrill regenerate content based on your new questions. You can also delete questions to remove related content from your report.
2. Select the files you want to analyze.
Up to 10 files can be uploaded at a time. If you want to analyze more files, check [method 2](#method-2-generate-a-report-from-an-existing-dataset)
3. Wait for the report to generate.
Once ready, you can download the report as a Word, Markdown, or PDF file, or open it directly in Notion or Google Docs for editing and sharing.
4. Edit the questions you don't like and let Powerdrill regenerate content based on your new questions. You can also delete questions to remove related content from your report.
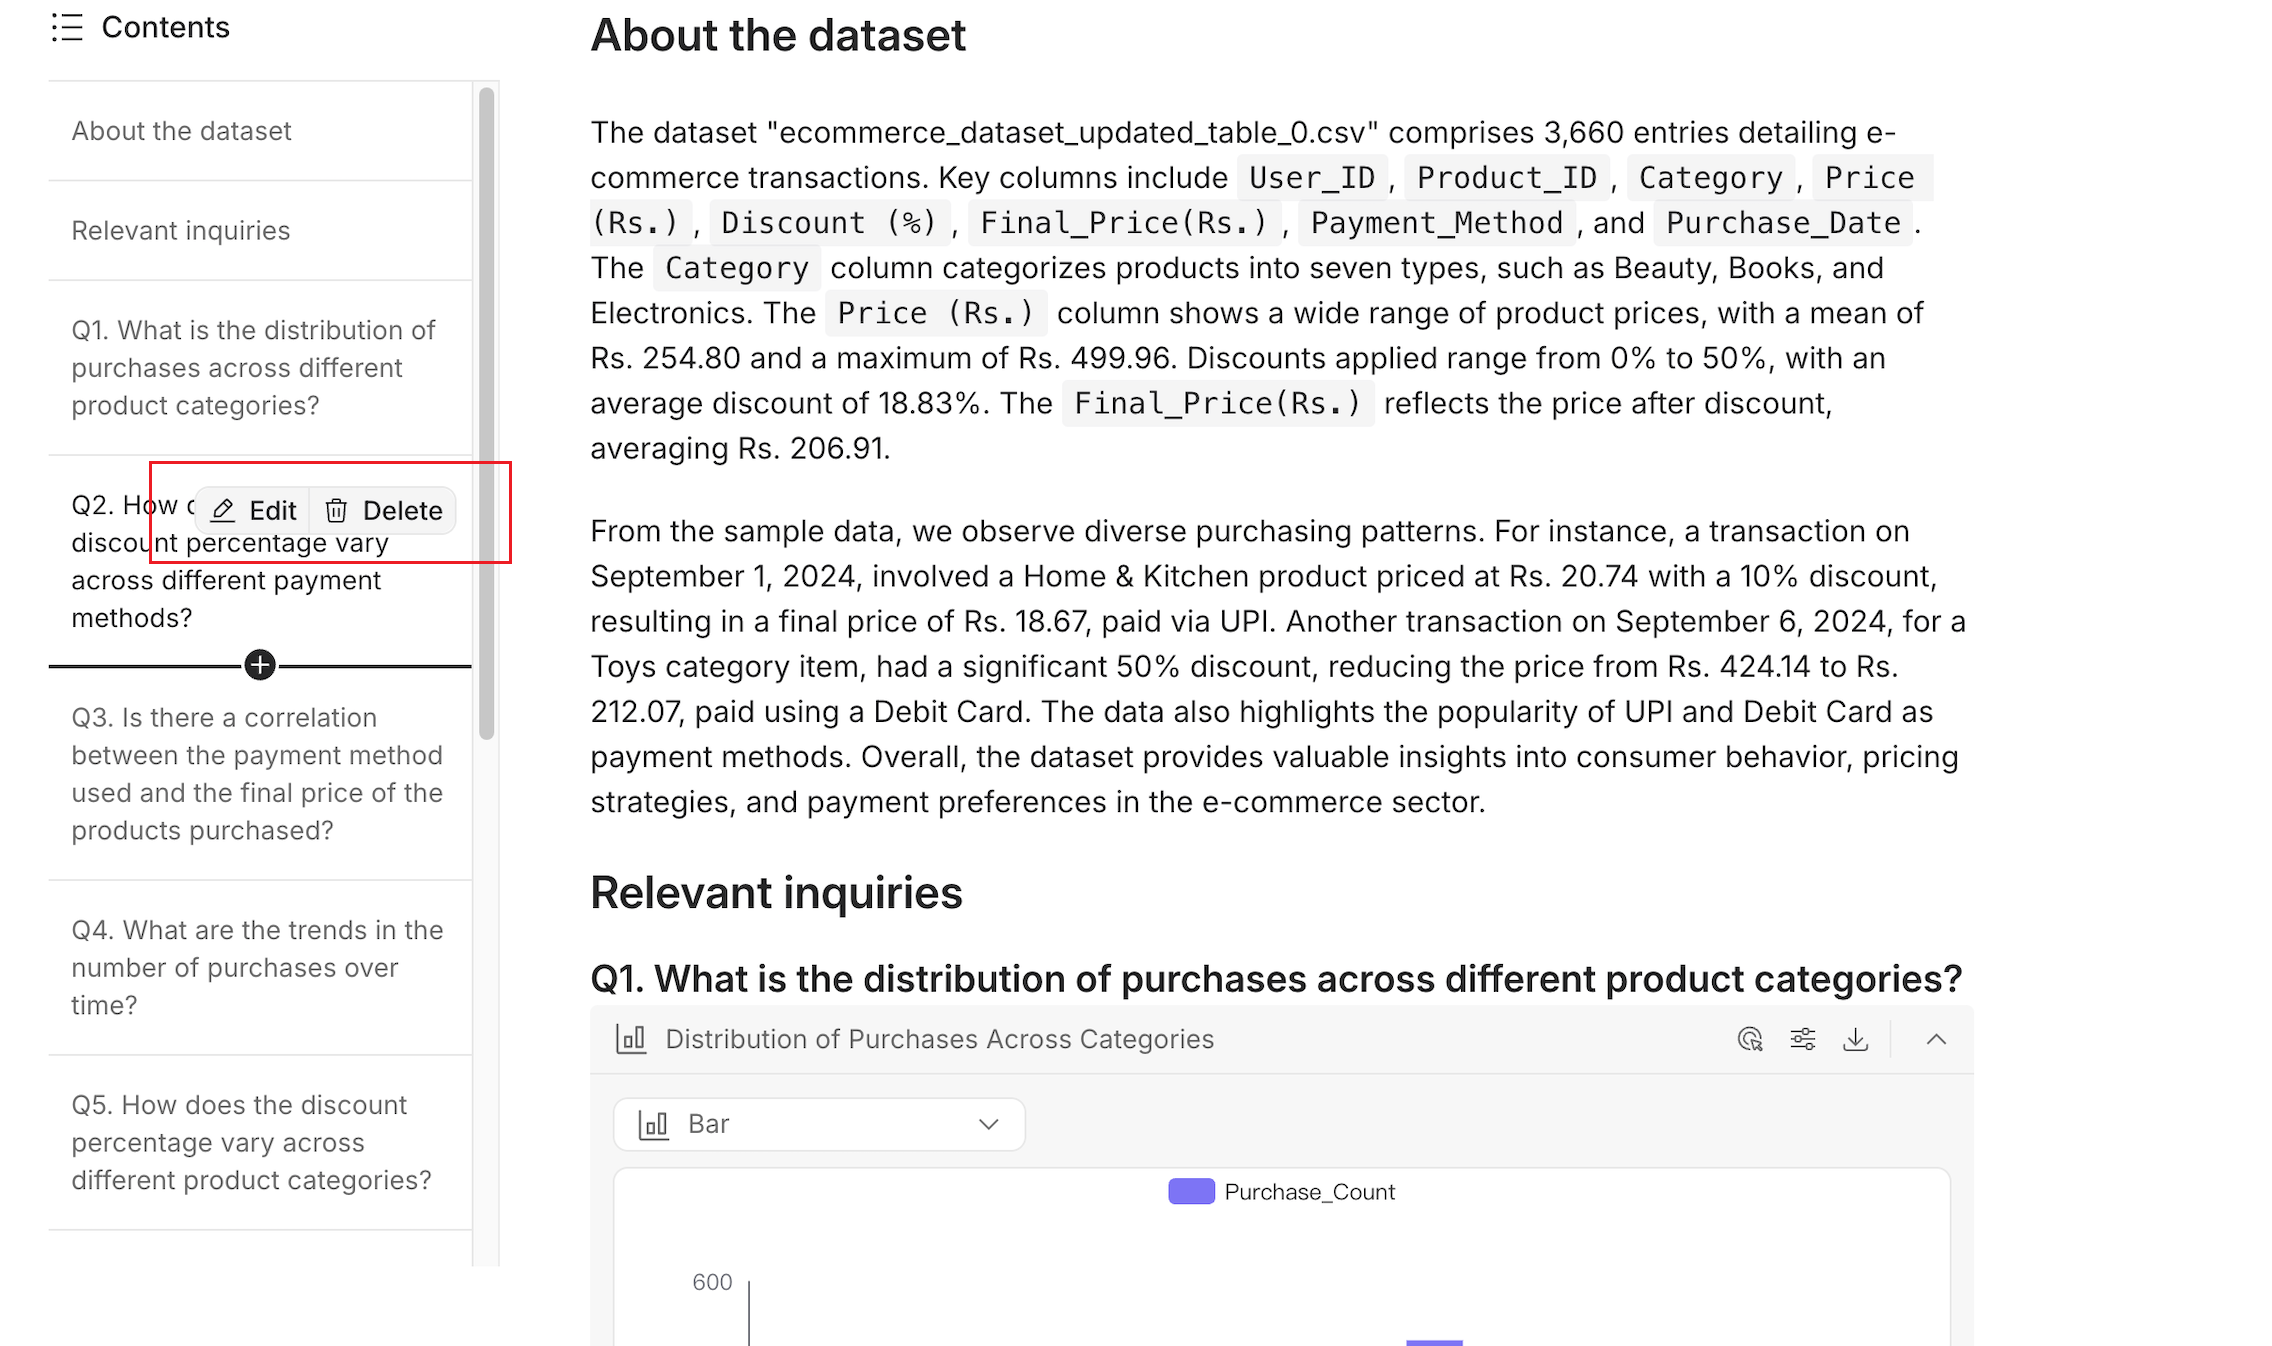 Additionally, you can click **Convert to presentation** to transform the data report into a presentation. For more details on creating AI presentations, see [AI Presentation Maker](features/ai-presentation).
### Method 2. Generate a report from an existing dataset
1. On the homepage, click **Start a new chat** at the bottom.
Additionally, you can click **Convert to presentation** to transform the data report into a presentation. For more details on creating AI presentations, see [AI Presentation Maker](features/ai-presentation).
### Method 2. Generate a report from an existing dataset
1. On the homepage, click **Start a new chat** at the bottom.
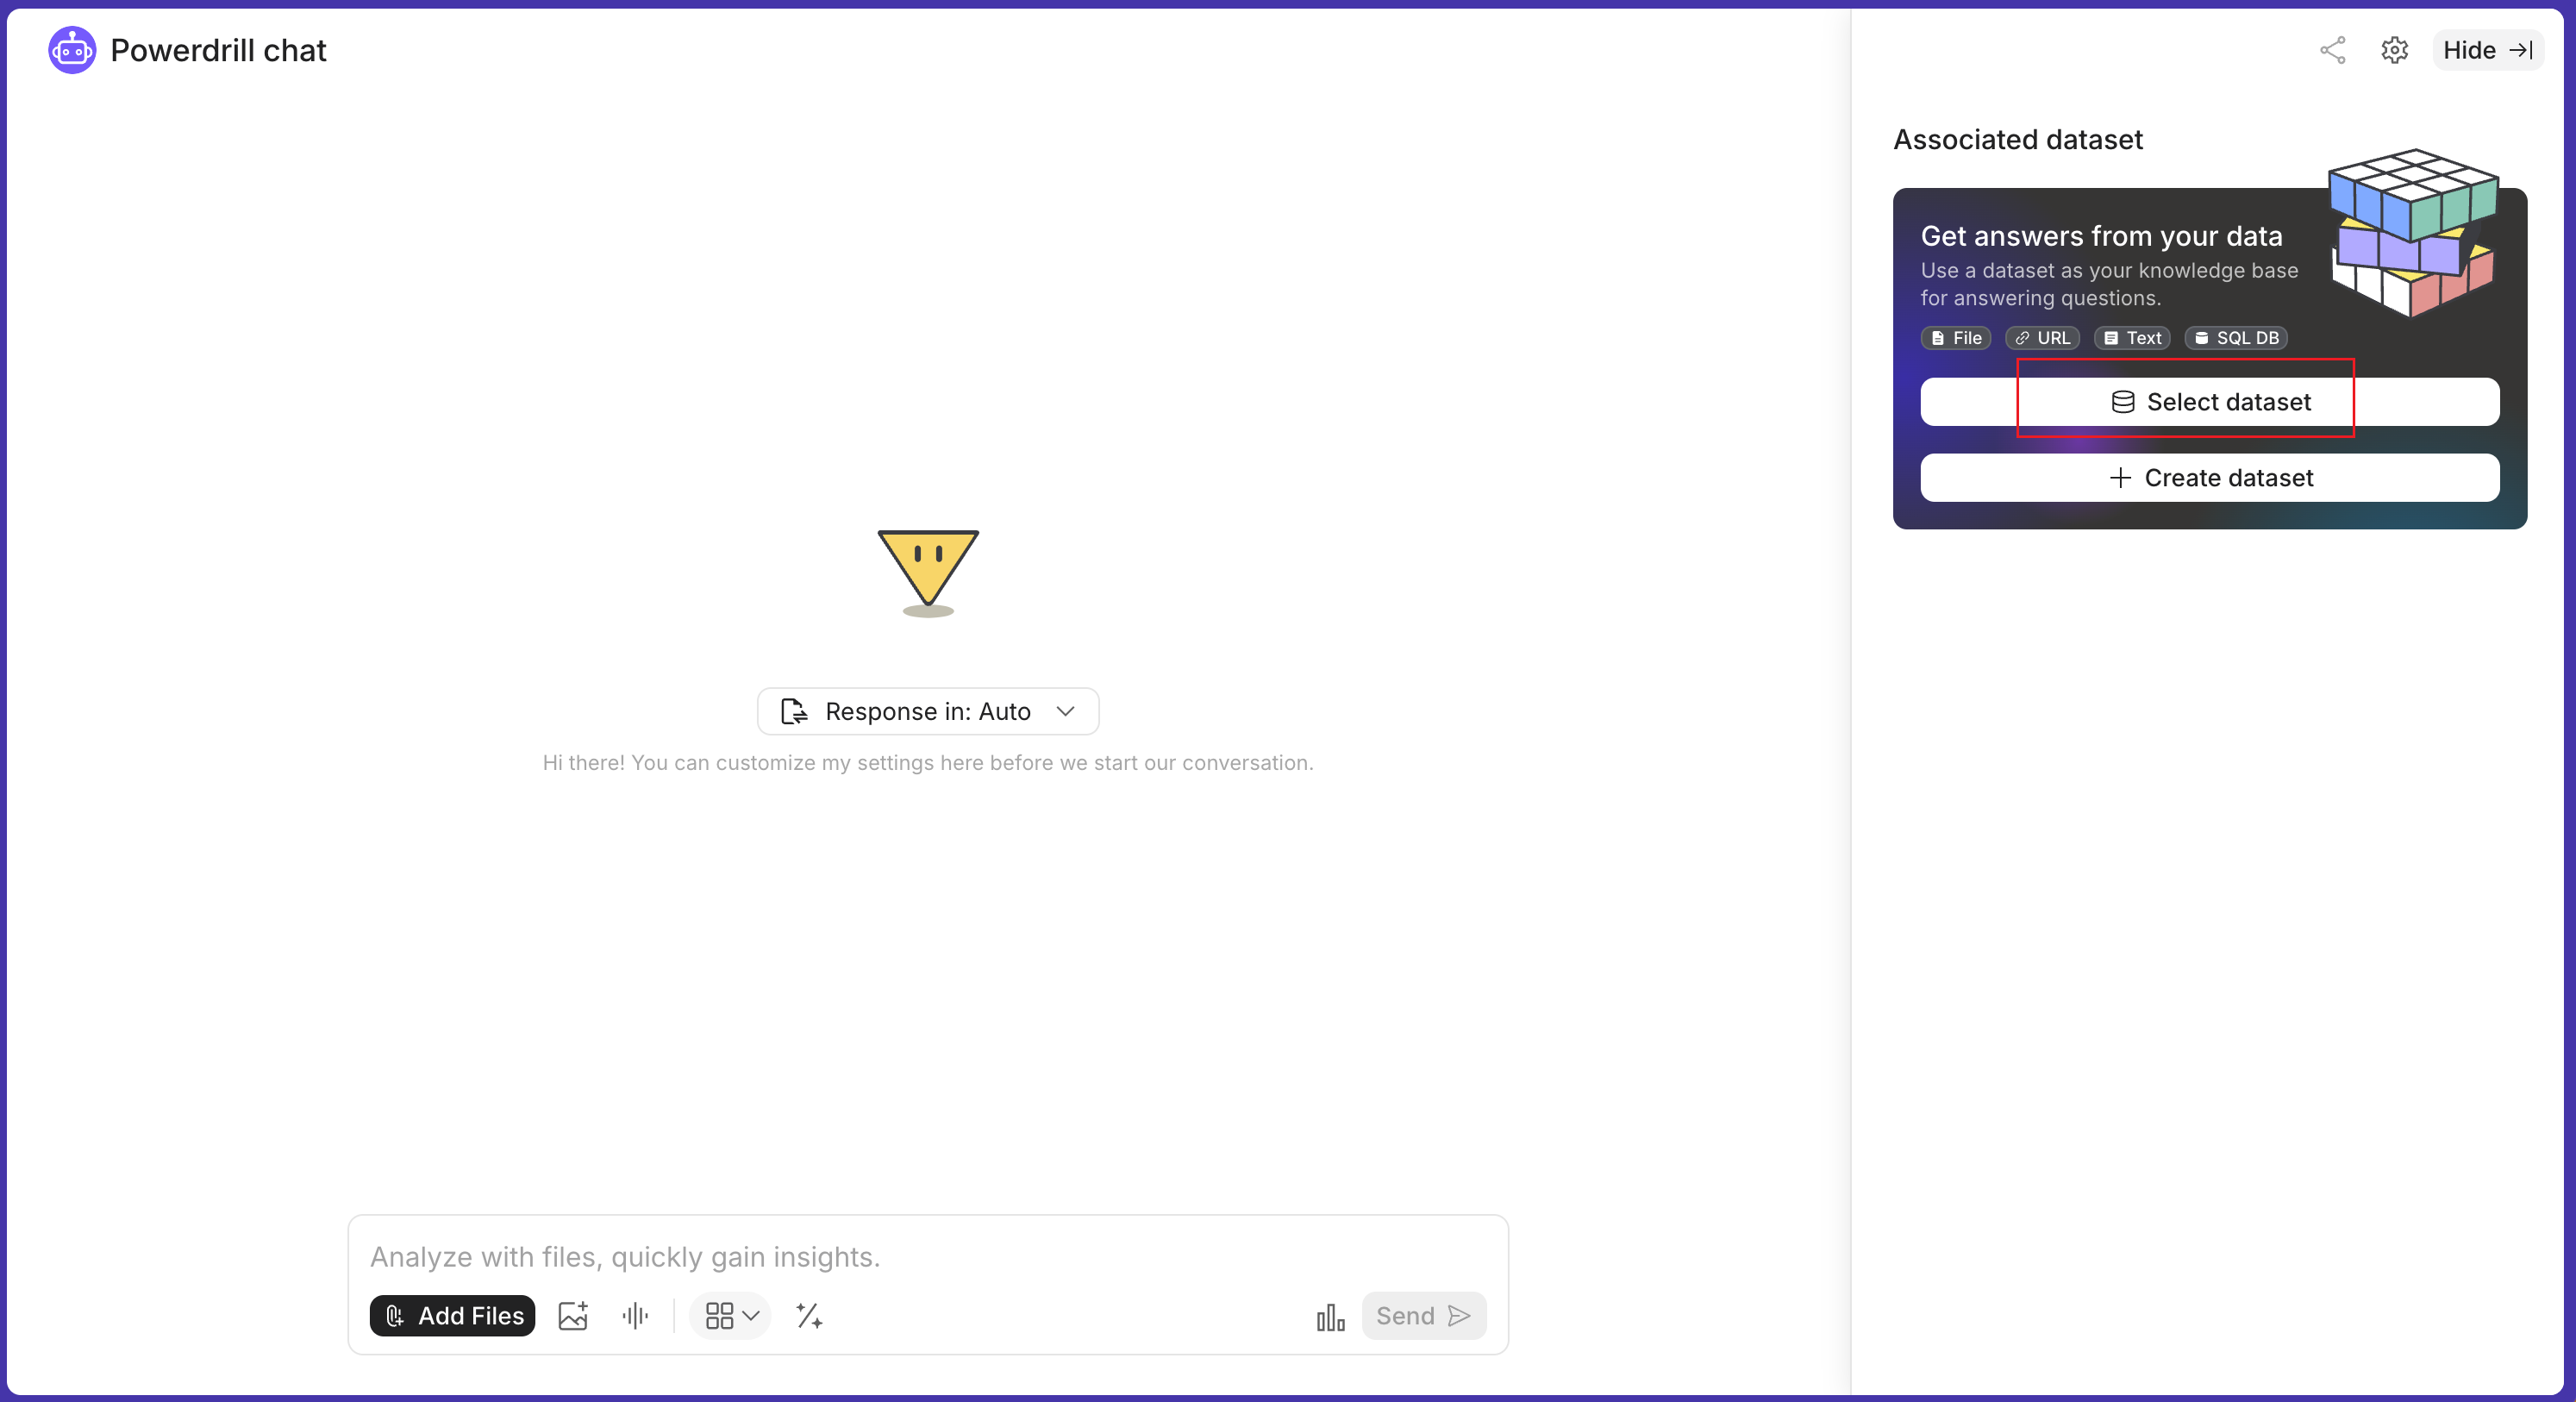
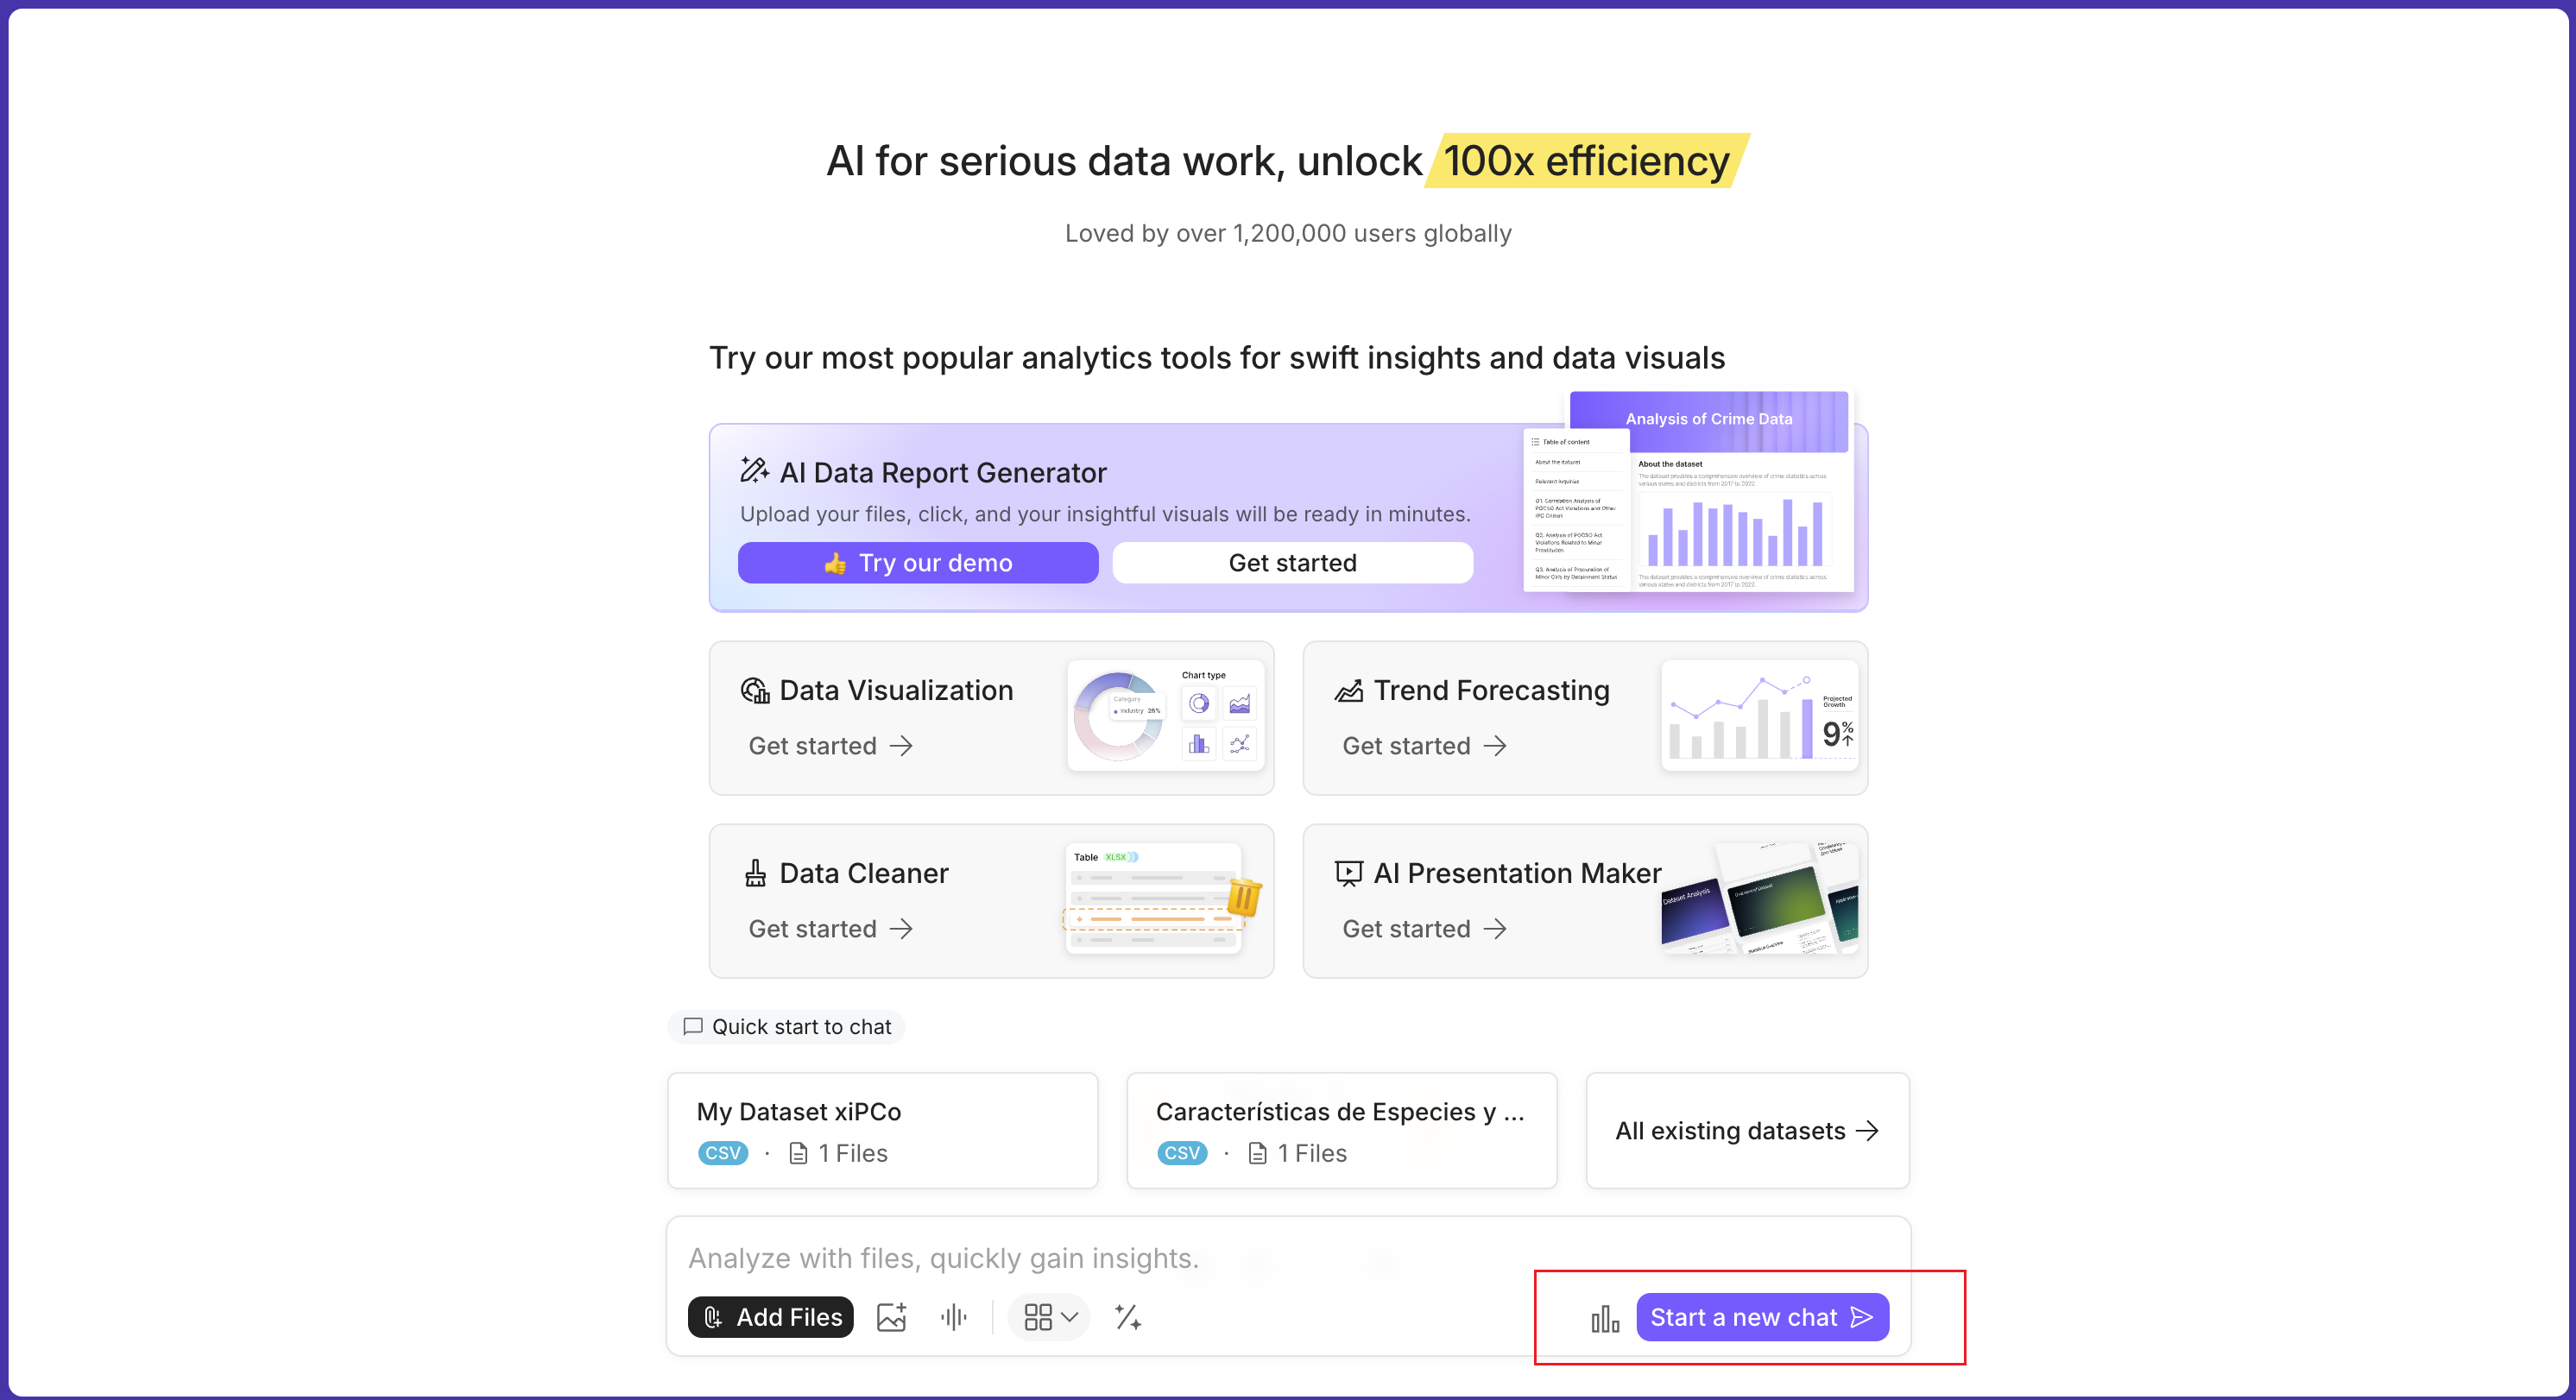 2. In the upper-right corner, click **Select dataset**.
 3. Select the dataset you want to use.
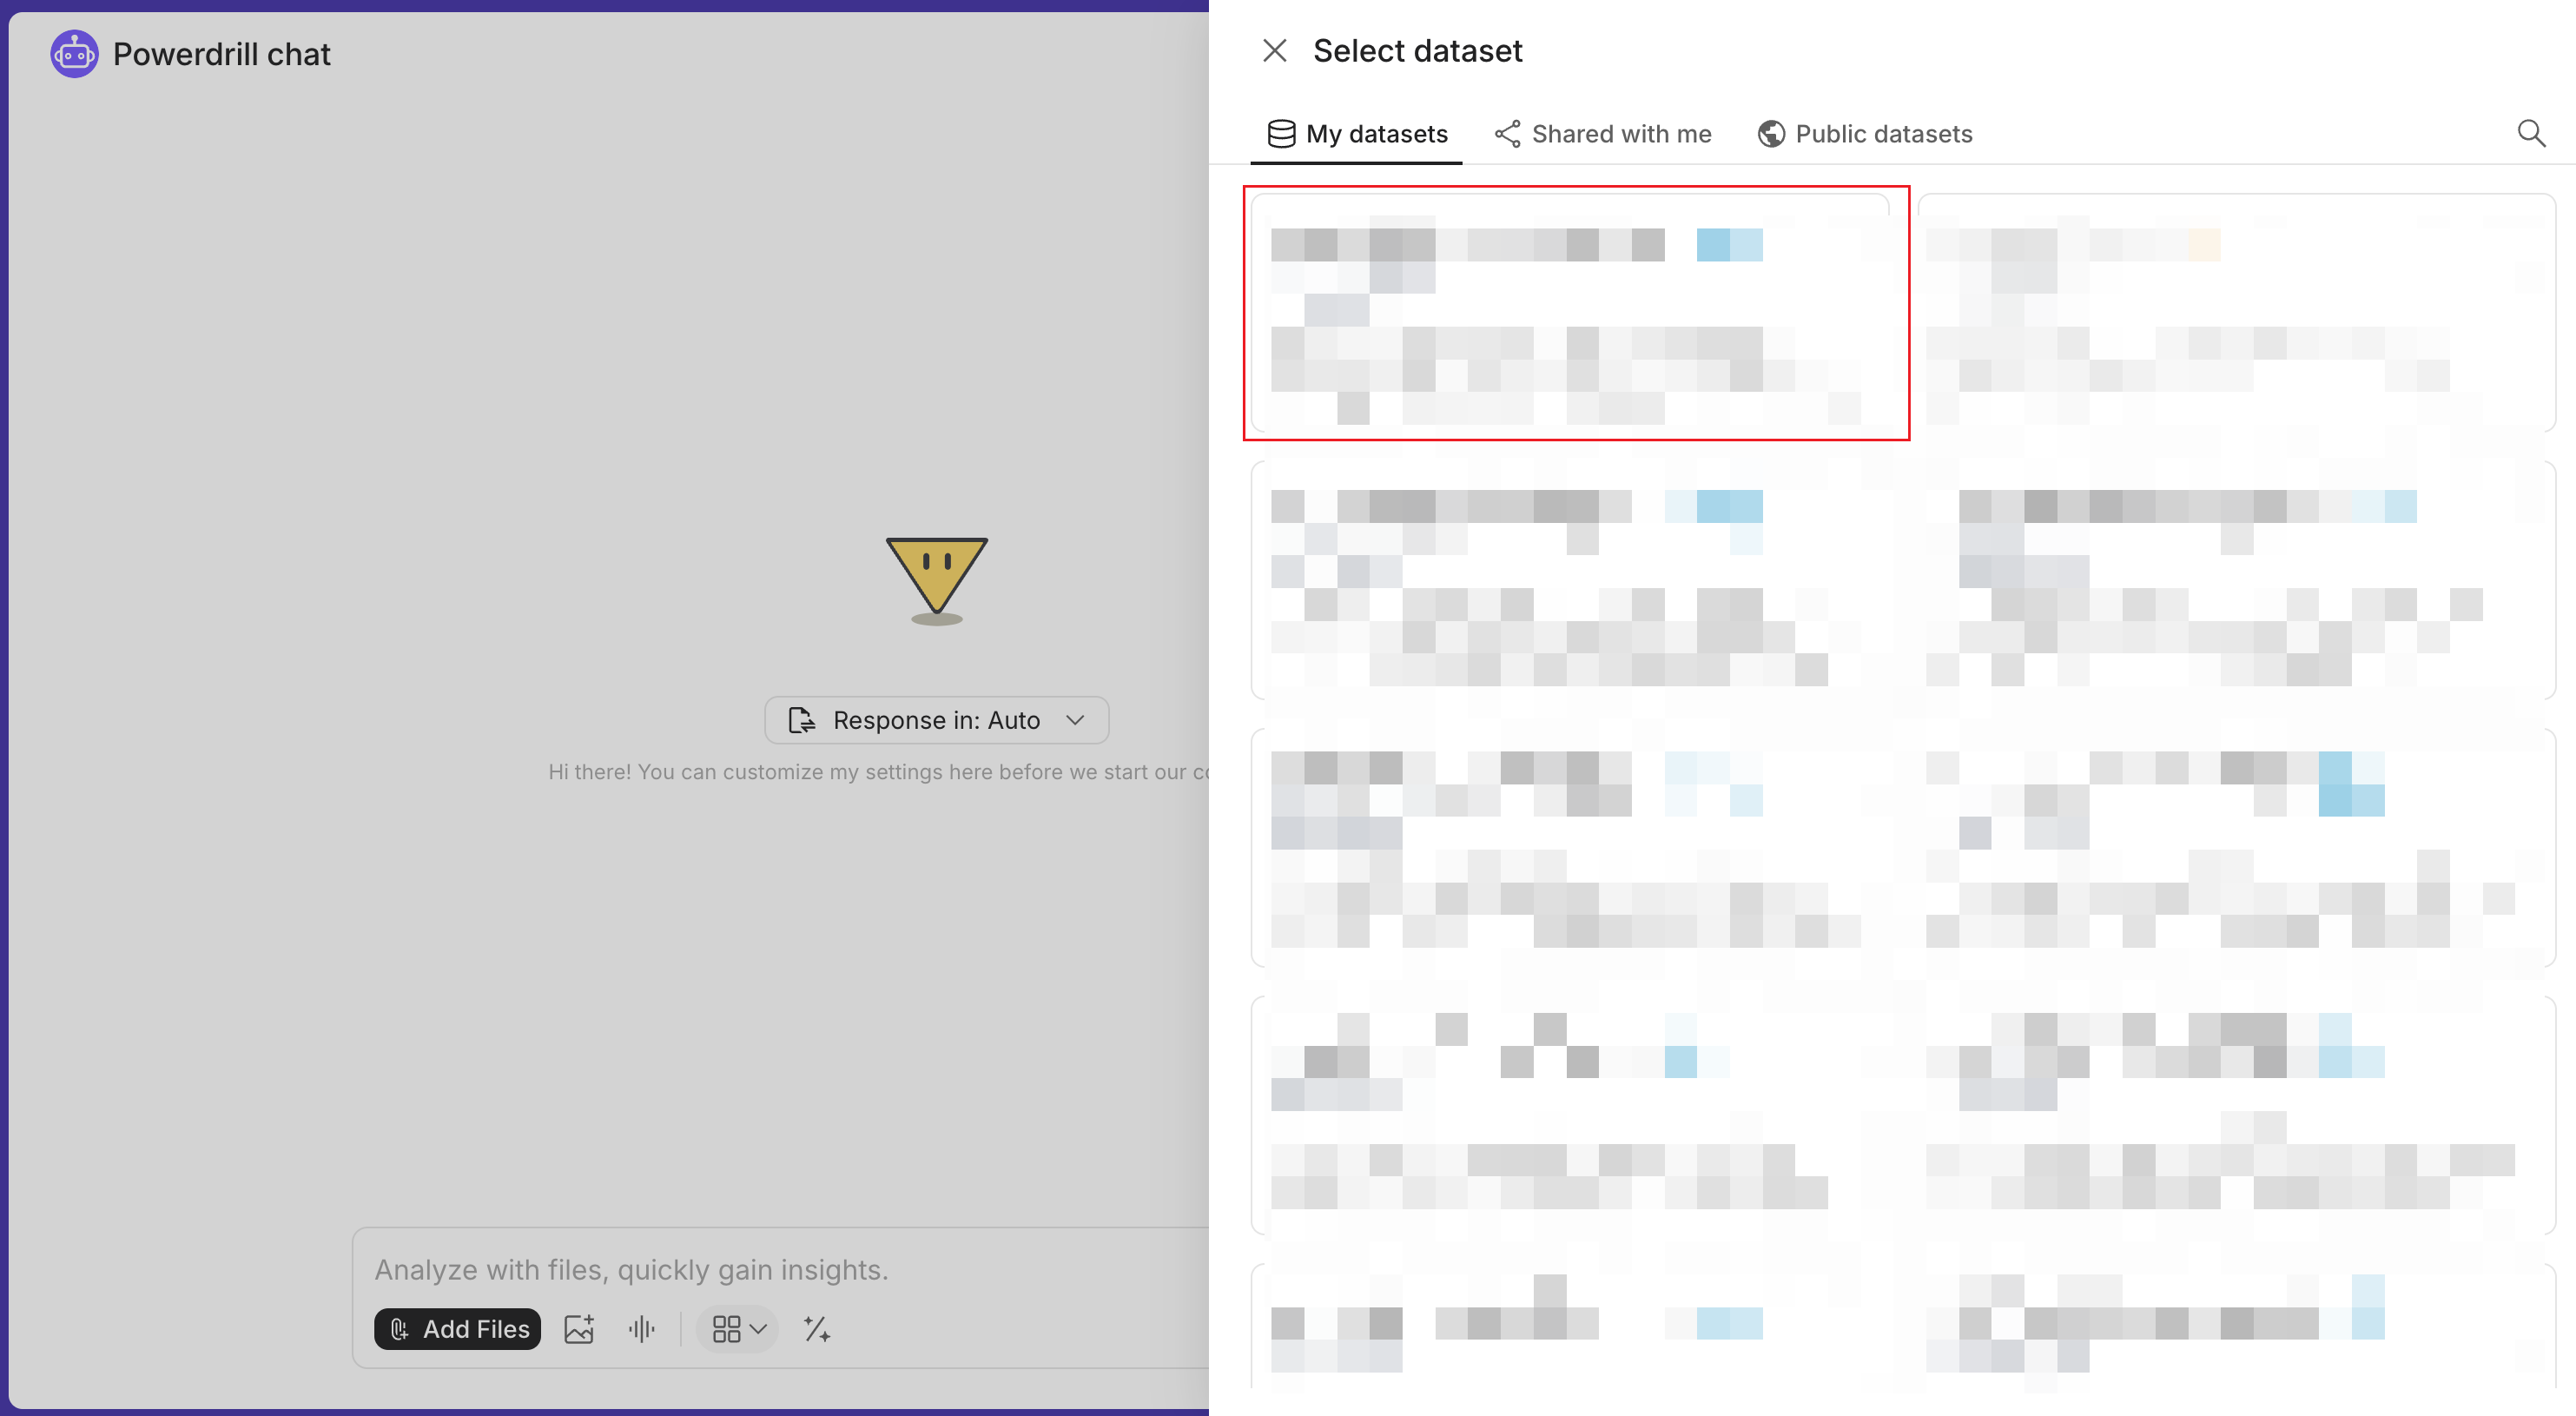 Ensure the dataset you select contain only CSV, TSV, Excel files. Otherwise, the report cannot be generated.
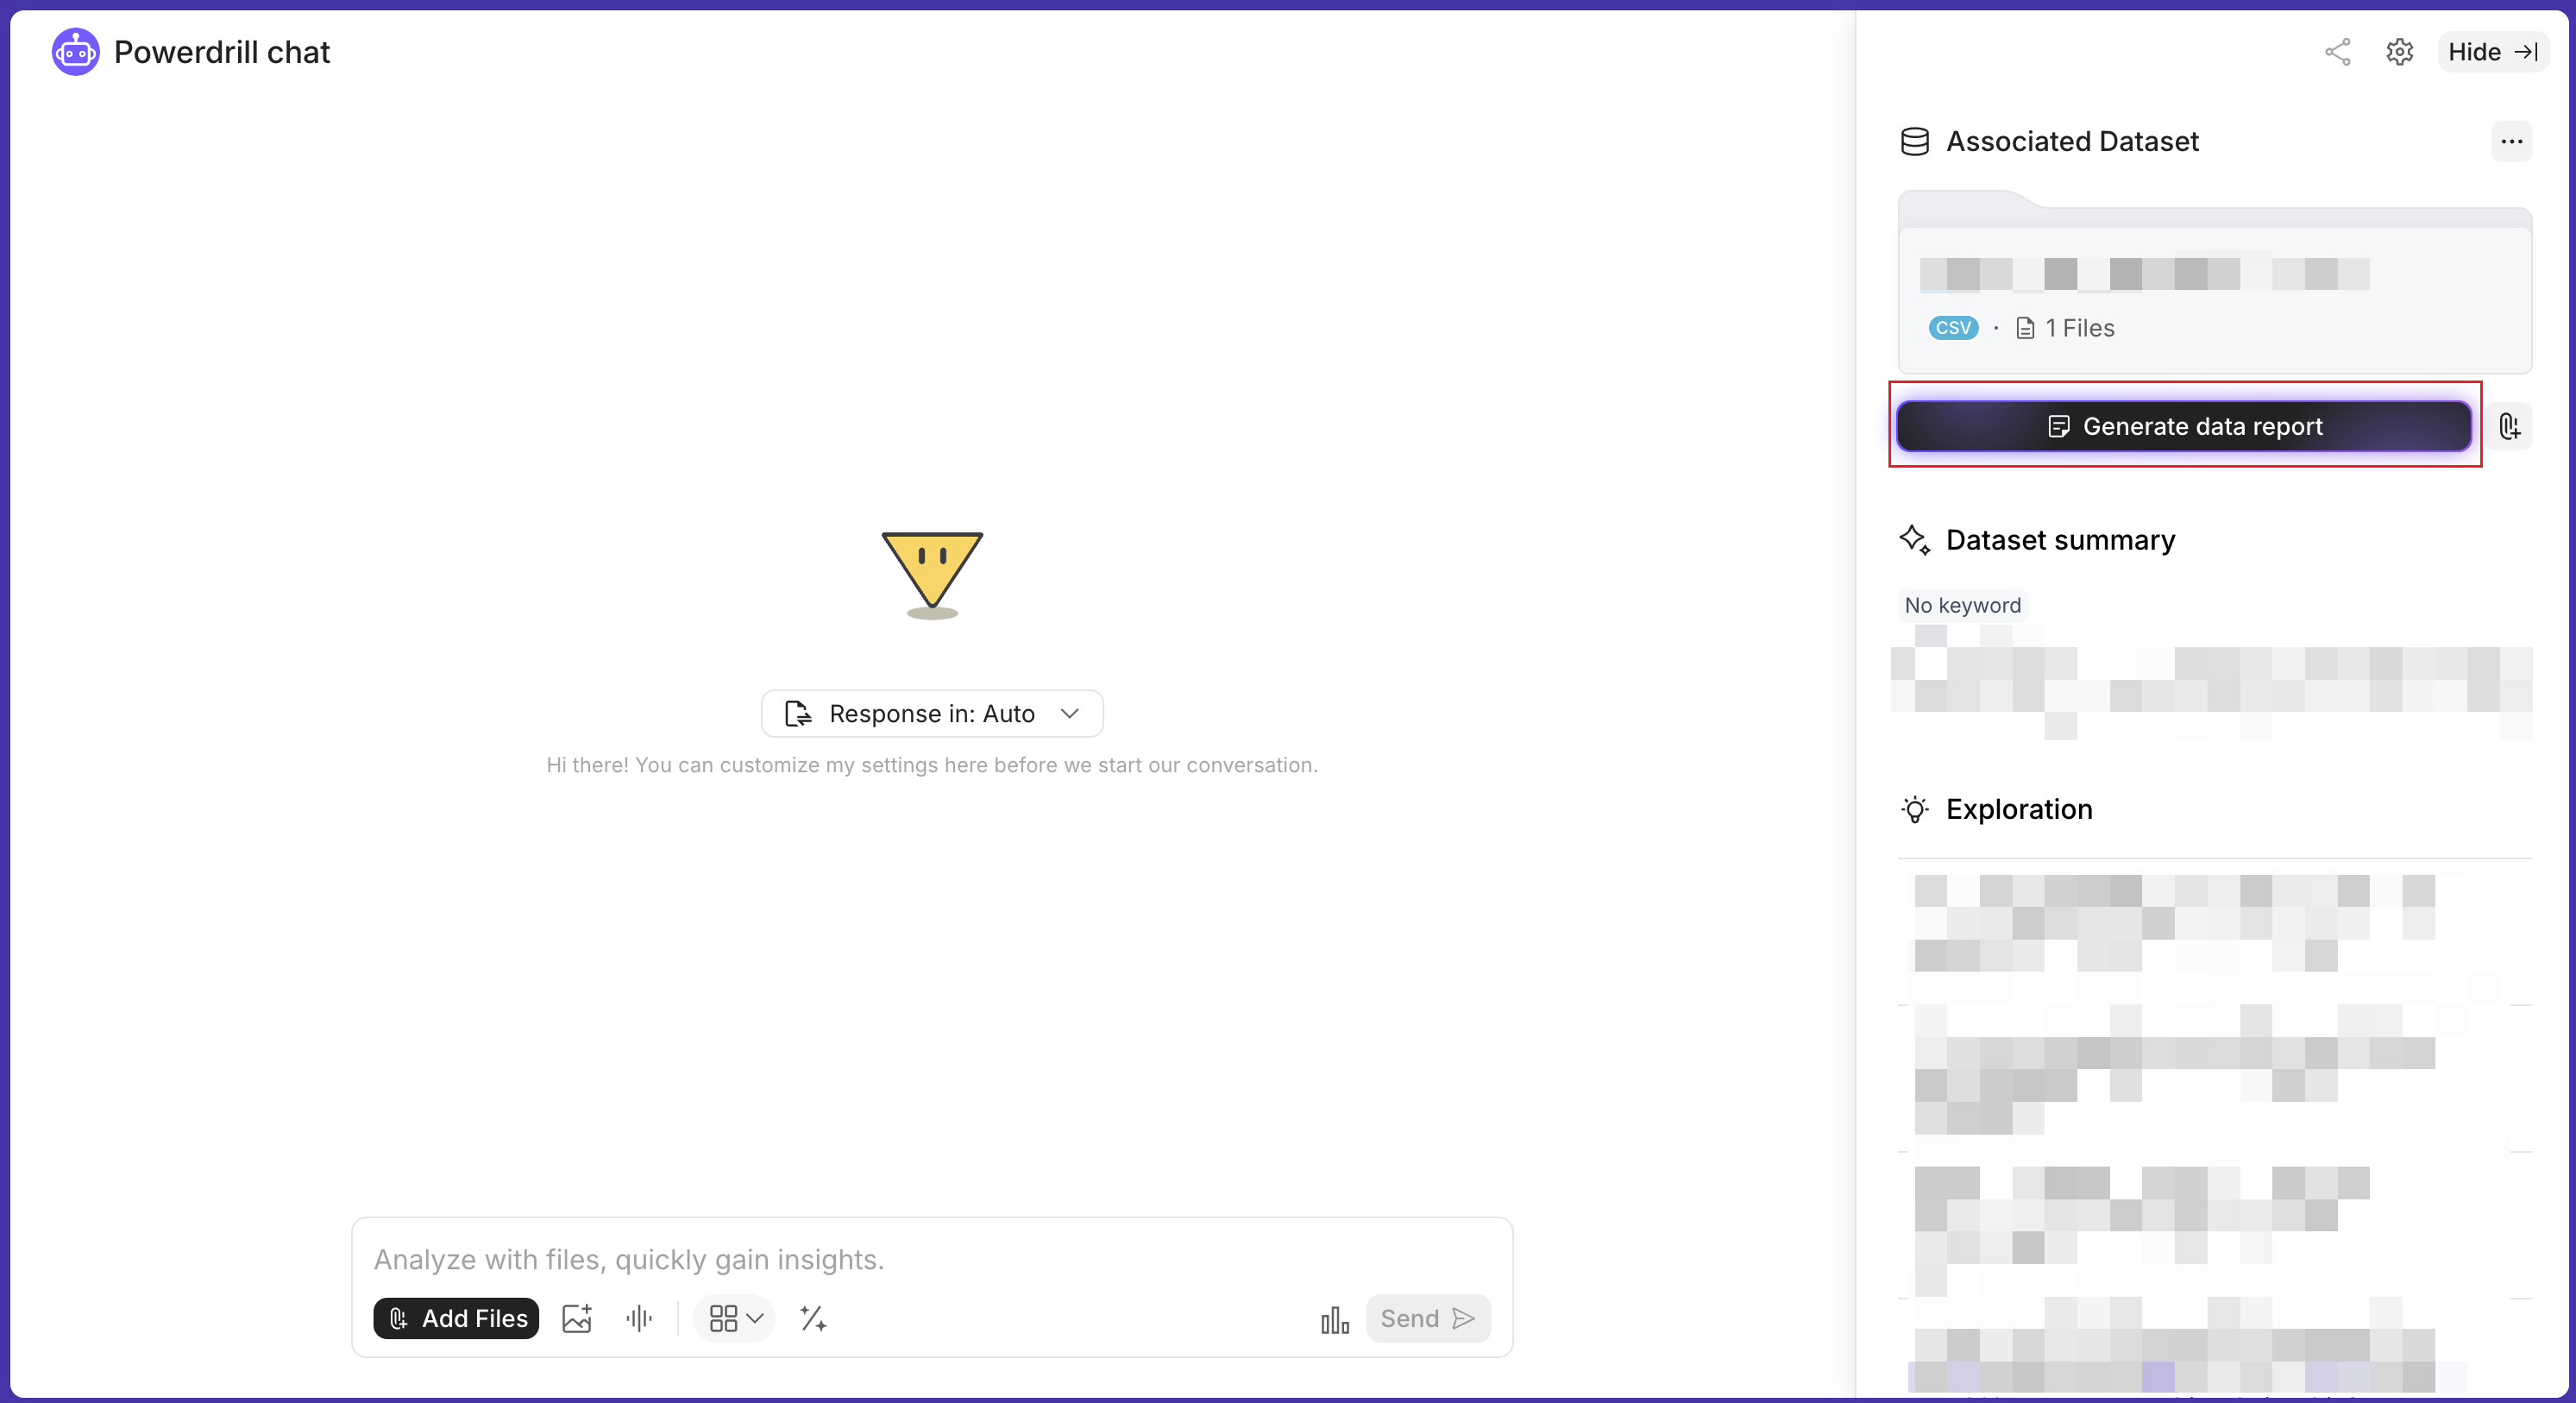
4. In the chat session page, click **Generate data report** in the upper-right corner.
Ensure the dataset you select contain only CSV, TSV, Excel files. Otherwise, the report cannot be generated.
4. In the chat session page, click **Generate data report** in the upper-right corner.
 5. Wait for the report to generate.
Once ready, you can download the report as a Word, Markdown, or PDF file, or open it directly in Notion or Google Docs for editing and sharing.
6. Edit the questions you don't like and let Powerdrill regenerate content based on your new questions. You can also delete questions to remove related content from your report.
Additionally, you can click **Convert to presentation** to transform the data report into a presentation. For more details on creating AI presentations, see [AI Presentation Maker](features/ai-presentation).
***
## FAQ
### What types of data are supported by the AI Report Generator?
The AI Report Generator currently supports CSV, TSV, and Excel file formats.
### Can I customize the charts/graphs generated in the data report?
Yes, some charts and graphs are customizable. For those that support customization, you'll see a toolbar in the upper-left corner of the chart, like this:
5. Wait for the report to generate.
Once ready, you can download the report as a Word, Markdown, or PDF file, or open it directly in Notion or Google Docs for editing and sharing.
6. Edit the questions you don't like and let Powerdrill regenerate content based on your new questions. You can also delete questions to remove related content from your report.
Additionally, you can click **Convert to presentation** to transform the data report into a presentation. For more details on creating AI presentations, see [AI Presentation Maker](features/ai-presentation).
***
## FAQ
### What types of data are supported by the AI Report Generator?
The AI Report Generator currently supports CSV, TSV, and Excel file formats.
### Can I customize the charts/graphs generated in the data report?
Yes, some charts and graphs are customizable. For those that support customization, you'll see a toolbar in the upper-left corner of the chart, like this:
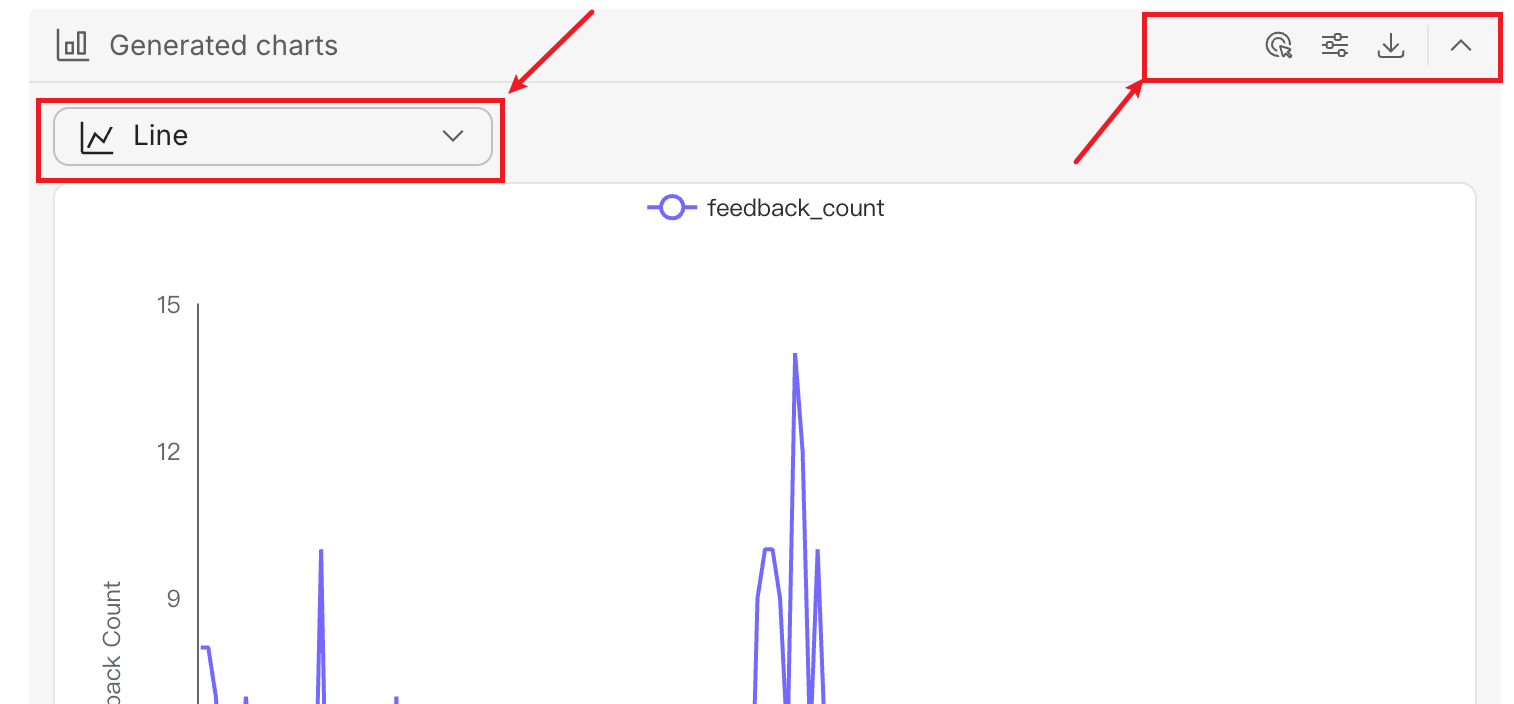 You can change the graph type. The AI Report Generator currently supports Line, Area, Bar, Pie, Doughnut, and Table graphs. Switch to the type that best fits your needs.
Additionally, you can download these charts/graphs as PNG or CSV files for further use.
## FAQ
### Can I edit the generated data report online?
No, but you can download the data report to your device or save it directly to your Notion or Google Docs account for further editing.
### Can I specify queries contained in a data report?
No, the data report is generated automatically. However, if you'd like to add personalized insights, you can follow these steps:
1. Download the data report or save it to your Notion or Google Docs account.
2. Start a new chat.
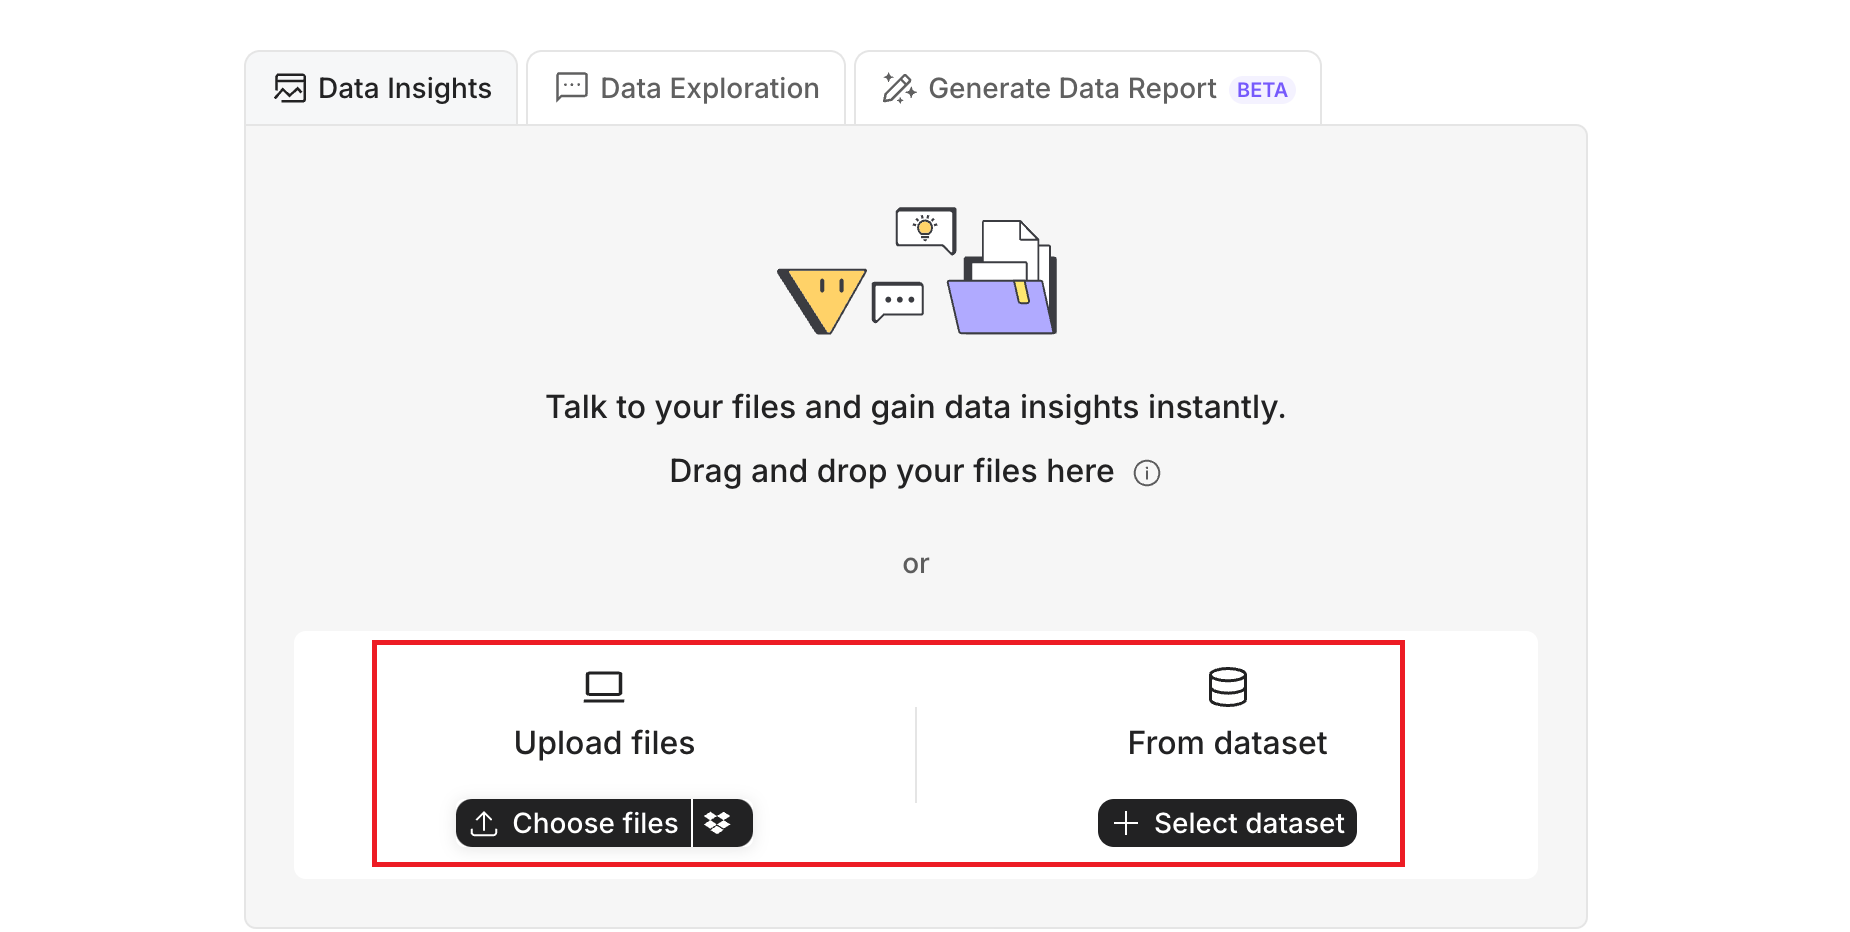
3. In the **Data Insights** tab, click the **Select dataset** button, and find the dataset that contains the files you used to generate the data report.
If you cannot find the dataset, you can upload the files again to create a new dataset instead.
You can change the graph type. The AI Report Generator currently supports Line, Area, Bar, Pie, Doughnut, and Table graphs. Switch to the type that best fits your needs.
Additionally, you can download these charts/graphs as PNG or CSV files for further use.
## FAQ
### Can I edit the generated data report online?
No, but you can download the data report to your device or save it directly to your Notion or Google Docs account for further editing.
### Can I specify queries contained in a data report?
No, the data report is generated automatically. However, if you'd like to add personalized insights, you can follow these steps:
1. Download the data report or save it to your Notion or Google Docs account.
2. Start a new chat.
3. In the **Data Insights** tab, click the **Select dataset** button, and find the dataset that contains the files you used to generate the data report.
If you cannot find the dataset, you can upload the files again to create a new dataset instead.
 4. Type your query in the message box, and let Powerdrill provide insights.
5. Once Powerdrill generates the insights, you can copy the content (both visuals and text) into your data report.
### Is this feature free?
Free plan users can generate one data report per month. To generate more reports, you can [upgrade your plan](https://powerdrill.ai/pricing).
***
## Need more help?
Get answers from our {community_0} members
Tell us more and we'll help you out
4. Type your query in the message box, and let Powerdrill provide insights.
5. Once Powerdrill generates the insights, you can copy the content (both visuals and text) into your data report.
### Is this feature free?
Free plan users can generate one data report per month. To generate more reports, you can [upgrade your plan](https://powerdrill.ai/pricing).
***
## Need more help?
Get answers from our {community_0} members
Tell us more and we'll help you out