> ## Documentation Index
> Fetch the complete documentation index at: https://docs.powerdrill.ai/llms.txt
> Use this file to discover all available pages before exploring further.
# Excel AI Analysis Best Practices
> Best practices for using Powerdrill AI to analyze Excel files
export const Powerdrill_0 = undefined
## Proper data formatting
Well-organized and clean data allows Powerdrill to carry out precise, error-free analysis and visualization. To ensure this, follow these best practices:
✅ **Column headers**: Use clear, descriptive headers in the first row.
✅ **Tabular structure**: Structure your data with records listed in rows beneath the headers.
✅ **Universality**: Use plain, widely understood language for column names, avoiding industry or company-specific terms.
### Some examples
**Figure 3**: The spreadsheet is structured
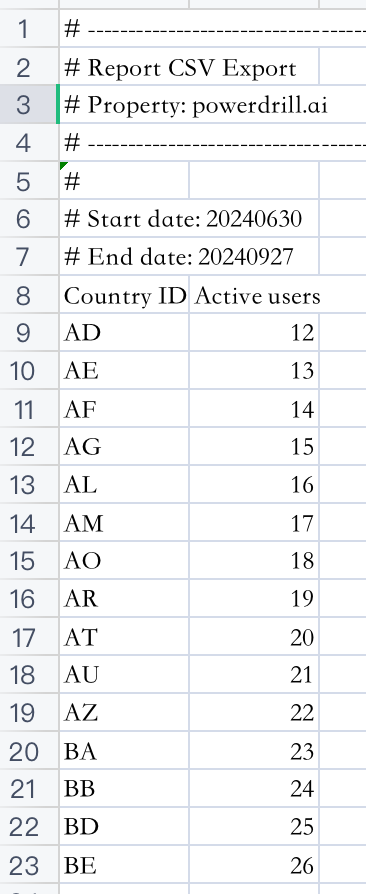
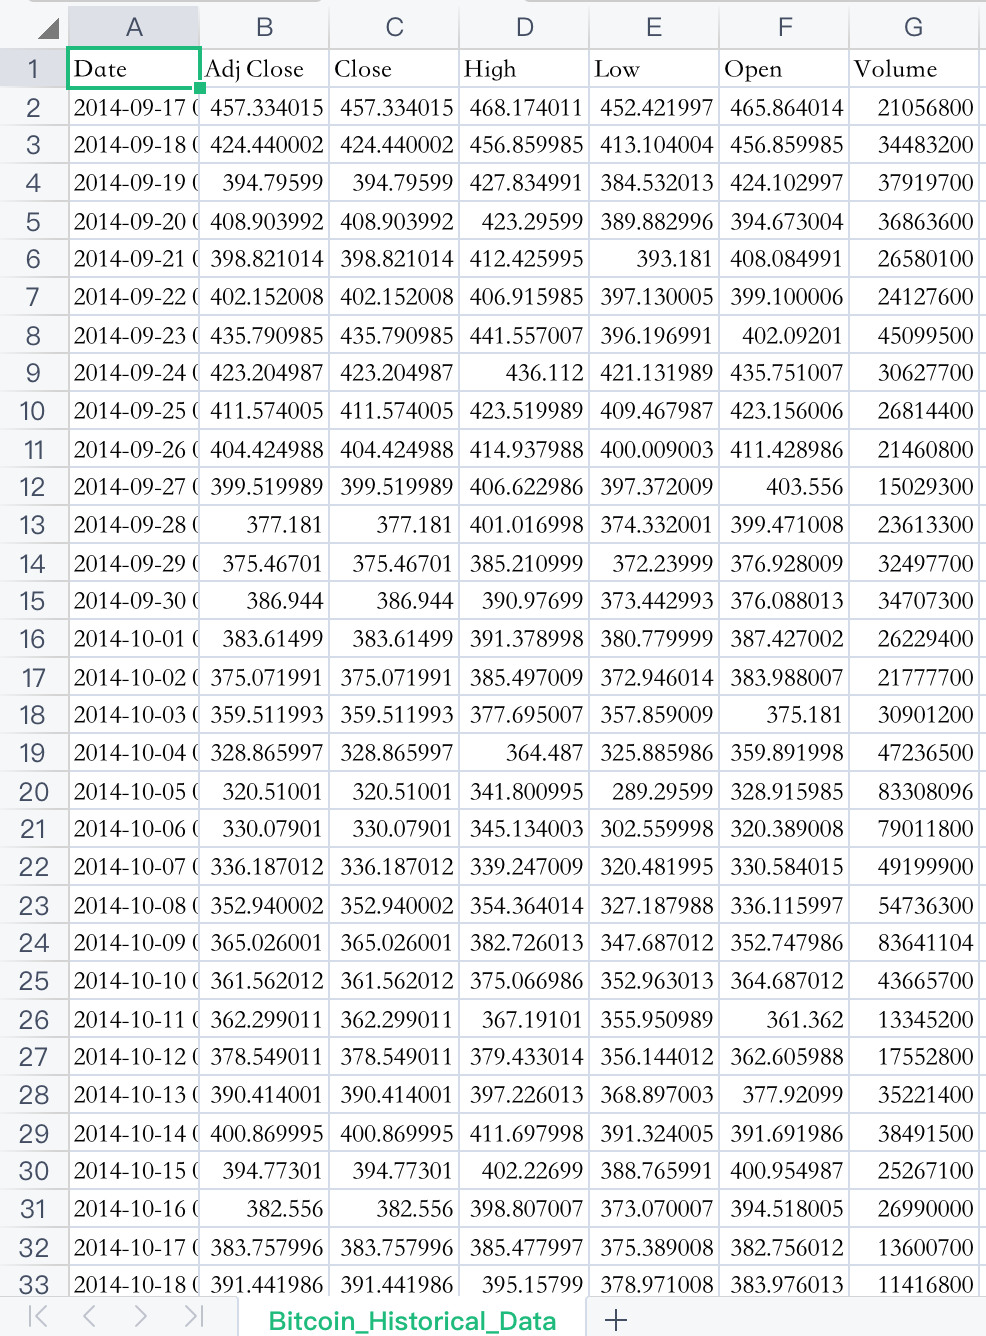 **Figure 4**: The main body of the spreadsheet is structured, though it includes titles and footnotes
 ***
## Improper data formatting
Composite spreadsheets or poorly formatted data may prevent {Powerdrill_0} from analyzing or transforming the information. To avoid issues, be mindful of the following common pitfalls:
❌ **Multi-level headers**
❌ **Too many empty rows / columns**
❌ **Irregular tables contained**
❌ **Multiple sections**
### Some examples
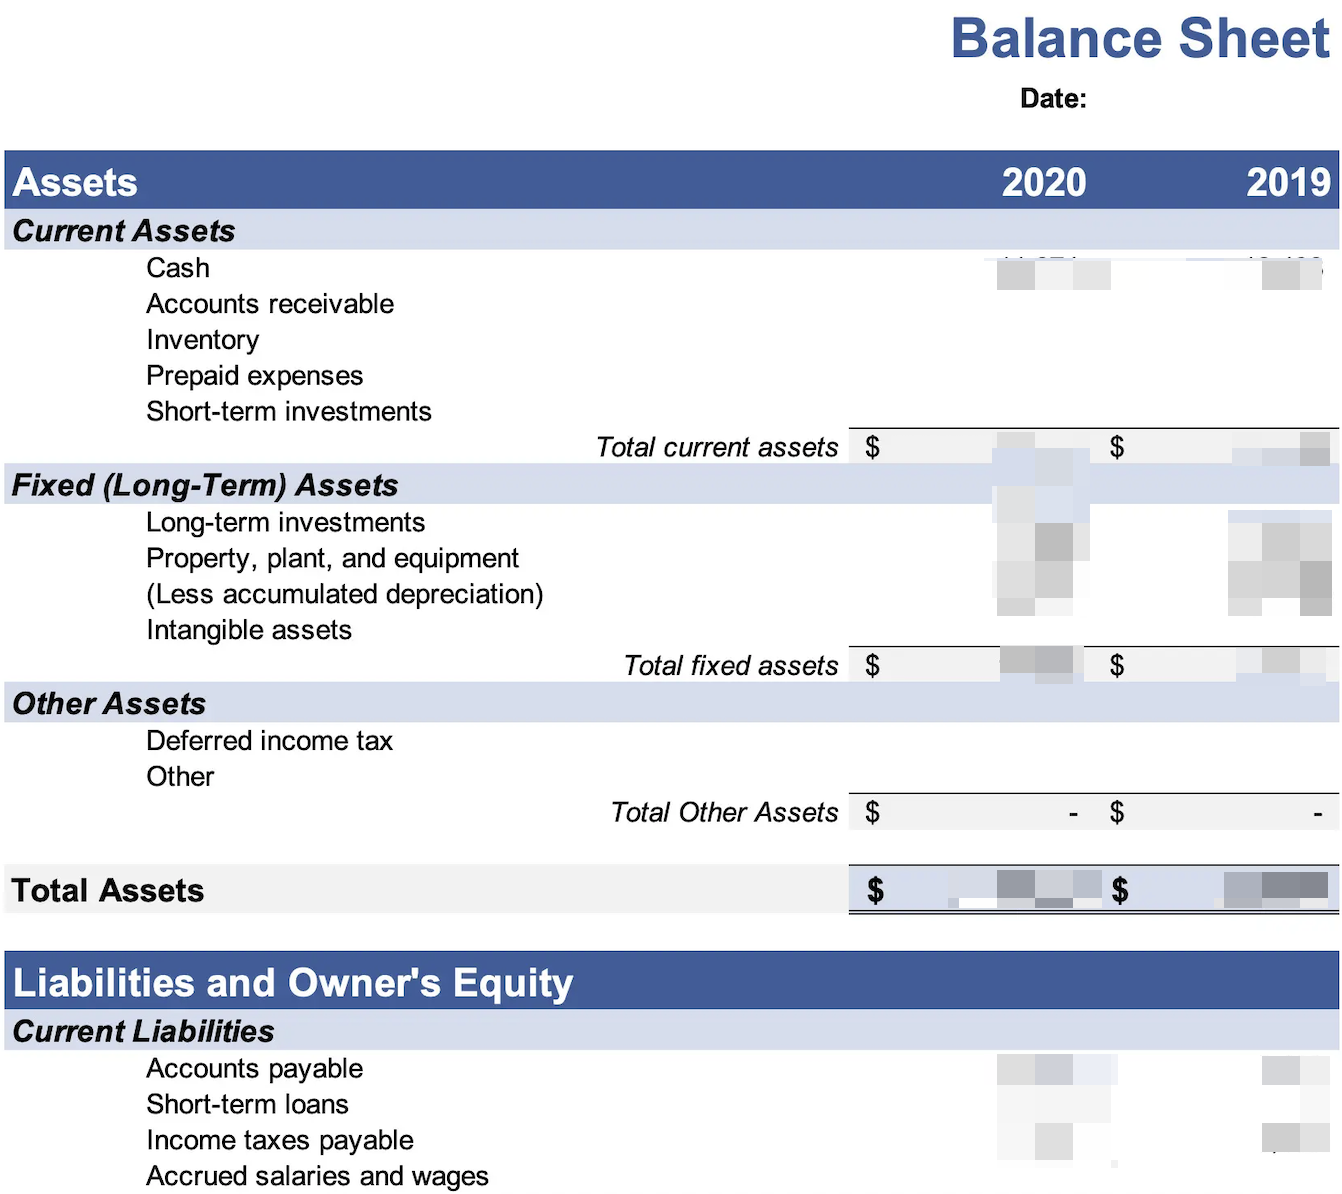
**Figure 1**: Spreadsheets with multi-level headers are difficult to index
***
## Improper data formatting
Composite spreadsheets or poorly formatted data may prevent {Powerdrill_0} from analyzing or transforming the information. To avoid issues, be mindful of the following common pitfalls:
❌ **Multi-level headers**
❌ **Too many empty rows / columns**
❌ **Irregular tables contained**
❌ **Multiple sections**
### Some examples
**Figure 1**: Spreadsheets with multi-level headers are difficult to index
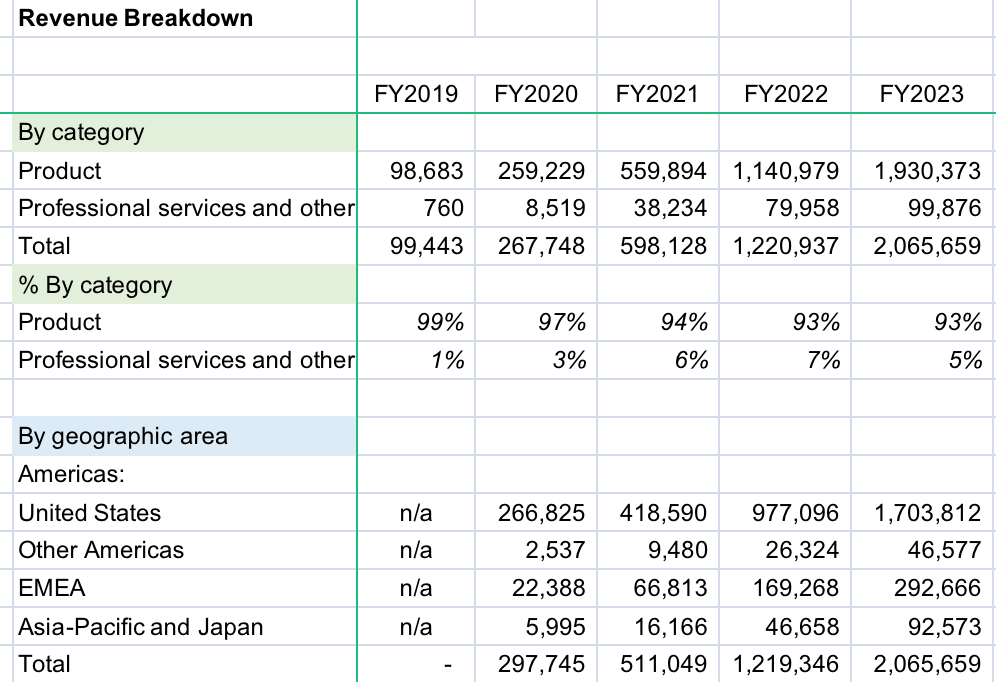 **Figure 2**: Spreadsheets with multiple sections, such as financial statements, should be formatted into tabular data